
|
Written by: Ronnel DG Last updated: 23 Sep., 2026 |

Your B12 website keeps a record of how many people visit, which pages they open, and where they came from. You can read that record in two places: the Analytics pane in the B12 Editor, or the AI Agent, which reads the same report and answers questions about it in plain language.
Note: Analytics reports are only available for launched websites. If your site is still on its b12sites.com address, see Publishing your website on a custom domain first.
Opening the Analytics pane
-
Switch to the
Menutab. -
Click
 Analytics
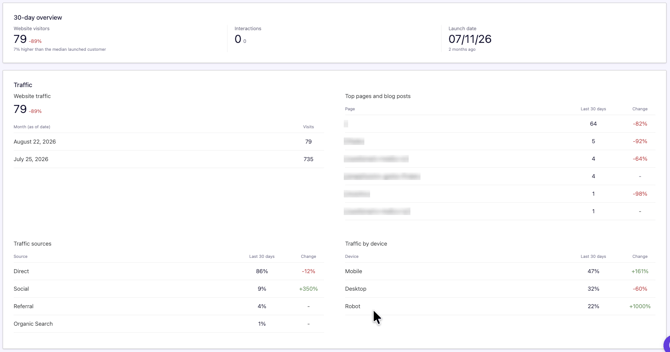 Reports are compiled once a week, so the figures you see can be up to a week old. Each report covers the last 30 days and compares that period with the 30 days before it, so you can tell whether a number is rising or falling.
Reading your traffic report
The report opens with a 30-day overview: your website visitors, your interactions, and your launch date. Each number carries a percentage showing how it moved against the previous period, and the visitor count is compared with a typical launched B12 website so you can see where you stand.
Below the overview, the report breaks the same 30 days into four panels.
- Traffic: your website traffic for the period, with a month-by-month list of visits underneath so you can compare a quiet month with a busy one.
- Top pages and blog posts: the addresses on your site with the most visits, each with its own change figure. A page that fell sharply is often one you edited or unlinked.
- Traffic sources: how visitors arrived, as a share of the total. Direct means they typed your address or used a bookmark, Organic Search means a search engine sent them, Social means a social media post or profile, and Referral means a link on someone else's website.
- Traffic by device: the split between mobile, desktop, and robot. Robot traffic is automated software, mostly search engine crawlers scanning your pages, not people. It is normal to see some, and it is worth ignoring when you judge how busy your site is.
- Interactions: contact activity your site received, counting form submissions and emails.
Asking the AI Agent about your traffic
The AI Agent reads the same weekly report, so you can ask about your website's performance the way you would ask a colleague. Open the Chat tab and type a question.
How is my website performing? Show me my traffic for the last 30 days.
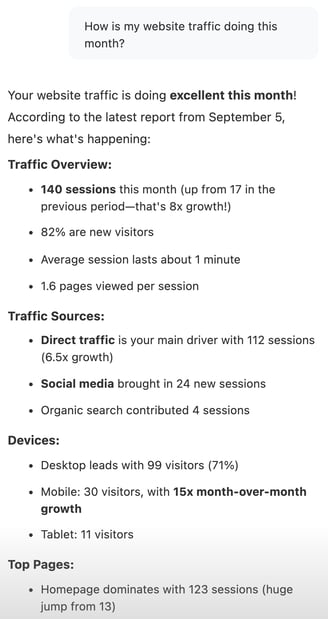
The agent gives you the figures, says how each one compares with the previous period, and points out what stands out. It also works out a few things the pane doesn't display, such as the share of your visitors who are new, how long a typical visit lasts, and how many pages a visitor opens before leaving. You can keep going with follow-up questions in the same conversation.
Which pages get the most visits, and where do visitors come from?
How many form submissions and emails did I get this month?
When you ask about contact activity, the agent offers to open your  Form submissions
 Contact manager
Tip: The agent can act on what it finds, not only report it. Try a follow-up like "My pricing page gets very few visits. Add a link to it in my main navigation."
Starting your first report
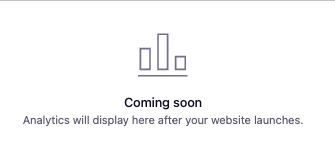
Analytics starts once your website is launched on a custom domain. Publishing to your b12sites.com address is not enough on its own. Until a domain is connected, the Analytics pane shows Coming soon, and the AI Agent tells you that analytics aren't available yet and suggests connecting a domain.
After you connect one, allow up to two weeks for your first weekly report to appear. If the pane is still empty after that, check that your domain is fully connected and publish your site once more.
Going deeper with Google Analytics
B12's report answers the everyday questions: how busy your site is, what people read, and where they came from. If you need custom date ranges, live visitor counts, or tracking for a specific button or page, add a free Google Analytics account alongside it. See Adding Google Analytics to your website. Both can run at the same time.
Frequently asked questions
→Why does my report say Coming soon when my site is already published?
⇒Analytics starts when your site is launched on a custom domain, and publishing to your b12sites.com address alone doesn't start it. Connect a domain and your first report should arrive within about two weeks.
→How often do the numbers update?
⇒Once a week. The Analytics pane and the AI Agent read the same weekly report, so a figure you see today may be up to seven days old.
→Why don't the AI Agent's numbers match Google Analytics?
⇒The two count visits in different ways and cover different time windows. B12's report is compiled weekly from your site's own visit records, while Google Analytics updates continuously. Small differences between the two are normal.
→What does Robot mean under Traffic by device?
⇒It counts visits from automated software rather than people, mostly search engine crawlers reading your pages so they can list your site. Some robot traffic is normal and healthy. Read your visitor numbers with that share in mind.
→Why did one of my pages drop by a large percentage?
⇒A big change on a single page usually follows something you did, such as renaming the page, removing a link to it, or replacing it. It can also be a quiet month for a page that only ever gets a handful of visits, where two visits fewer reads as a large percentage.